Saturday, November 21, 2009

Improving Problem Solving Through Visualization

This is an interesting video that compared the number of ideas people came up with when using visualization tools vs. discussion. In many other research arenas, especially Cognitive Psychology, images have been shown to trigger new ideas and the ability to come up with more solutions to problems by jumping back and forth between forming/watching images & problem solving. And it seems like the more interactive the image, the better the ability to think through problems is. Many of these studies focus on ability to solve math problems, but it would be cool to see an expansion to other fields....these are a couple of reads in this area:

Imagery and Mental Models in Problem Solving. Yulin Qin and Herbert A. Simon, Carnegie Mellon University. From AAA Technical Report (www.aaai.org), 1992

Dynamic Representation of Financial Ratios: a Design and Empirical Test, by Lin Zhao - dissertation, 2008.


Wednesday, October 14, 2009

Computational Speed in Communication

I've been reading a lot of research papers recently about imagery and how it affects computational speed - the ability to quickly perceive the idea as compared with sentences. This is a pretty interesting article: Why a Diagram is (Sometimes) Worth a Thousand Words.

While this is not new, research shows this to mostly be the case only when the image itself is representative of existing knowledge - i.e, when you see a picture with a bottle of wine, the bottle means "alcohol, party, flush feeling" rather than "storage container". when the image does not fit your mental model, it might actually slow you down, because you have to question the meaning of that image in the new context.

This brings up the topic of how much time us visual communicators should spend researching what are images that are commonly understood. I was trying to figure out if there is a central repository somewhere - couldn't find any, but did find an interesting logo repository.

hmm...

Wednesday, August 26, 2009

Explaining the Model

I recently attended an International Forum for Visual Practitioners (IFVP) annual conference. Many of the participants were Graphic Recorders - people that record conversations and events visually (I highly recommend looking up the examples in the directory if you've never seen this type of work before).

From speaking to other facilitators and watching the event unfold, I realized that the skills needed for recording are often different than those needed for graphic facilitation or communication. Many of the conversations I had at the conference centered on trying to better understand those differences.

The Visual Extension model and structure for this blog will try to further explore the differences in tool usage and skills needed by visual practitioners depending on the type of work they are doing.

So what is the model about?


1. Practitioner/Participant Direct Engagement


The degree of participation we practitioners working with visuals have with their audience varies. It seems to me like the range moves from:
  • Visual practitioners creating articles (murals, posters, books or designs) with little or no interaction with the audience. The Audience interacts personally with the visual but cannot change it.
  • To more interactive participation like the audience’s manipulation of the visual itself (infographics) or the use of the visual to manage of the audience (when an image is used to affect the conversation/mood of the room – color, shocking concept).
  • To direct engagement between the practitioner, audience, and image to manipulate the image.
2. Visual Usage for input/Output

The second piece to the model is Output vs. Input - and what visuals are used for. Getting information out of people’s head (Input) is different than transmitting information into people’s heads (Output). An post from a VizThink forum addresses this question. Jeff Bennett created his own model to explain how information is transmitted.

How visuals are used varies by the goal – when getting input, the focus is on getting attention, organizing, getting participation, and boiling down information. When transmitting information to others, the focus is on how to help the person get interested and interact with the visual, “read” the message, and reach the “right” conclusion about what it means to them/actions they need to take.

How does this model relate to what you know about the use of visuals in group processes?


Saturday, August 22, 2009

Using Visuals as an Extension

I have been dabbling with the use of pictures since I was a kid - illustrating sing-alongs, school books, stories, and painting murals.

When I stepped into the corporate world I thought I was saying goodbye to my visual background. Work is serious, and pictures are for fun, I thought.


But slowly I started seeing something very strange happening - as an Analyst and Process Consultant I needed to understand what people did and see ways they could do it better. But often when people "told" me what they did, I ended up with a big pad of messy notes, not sure how to put it together.

And how could I explain to my managers the impact of a person walking from the front of the room to the back too often? just saying it out loud sounded silly.


So I started drawing - I drew people's movement pattern, I color coded the personnel on a floor, and I wrote strategies up on the board in a way that was visible to all to see and comment. I was just doing my job, I thought, getting the message across or getting information organized.

A bit over a year ago, while working on my Masters in Organizational Development, one of my Professors at Bowling Green State University took the class to Root Learning, a company that creates visual learning tools and strategy maps. My jaw dropped. You mean there are actually organizations out there defining themselves by the use of visuals? and helping organizational increase competencies in the meantime?

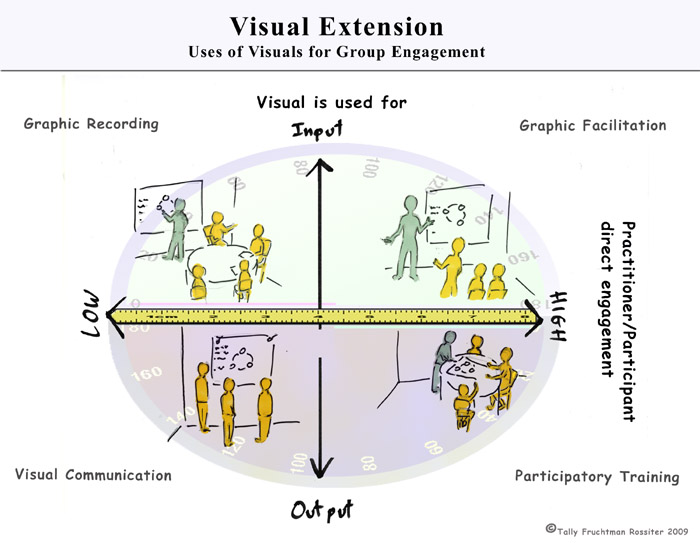
In the past year, I have been learning more about visuals and their uses. Stuff that came naturally to me before like capturing information in a visible place, or telling visual stories to demonstrate strategic concepts, became stuff with a "name" : Visual Recording, Visual Facilitation, Visual Thinking, Visual Communication, Visual Learning.

But what's the difference between these? and how are Visuals used differently in all these names or functions? Do they require different skills of the practitioner using them? Or impact the audience/user differently?

This will be topic of this blog. I hope to find others interested in this topic who are willing to share their thoughts, opinions, and tools/usages they've found appropriate.

Tally